Read the flow
Start with the ribbon and the market status box. Green supports bullish ideas. Red supports bearish ideas. Mixed colors mean slow down.
Bucko turns a busy chart into a clearer view of direction, key areas, setup labels, and risk. Less digging. More context for your next decision.
Educational charting tool. Not financial advice. Trading involves risk.
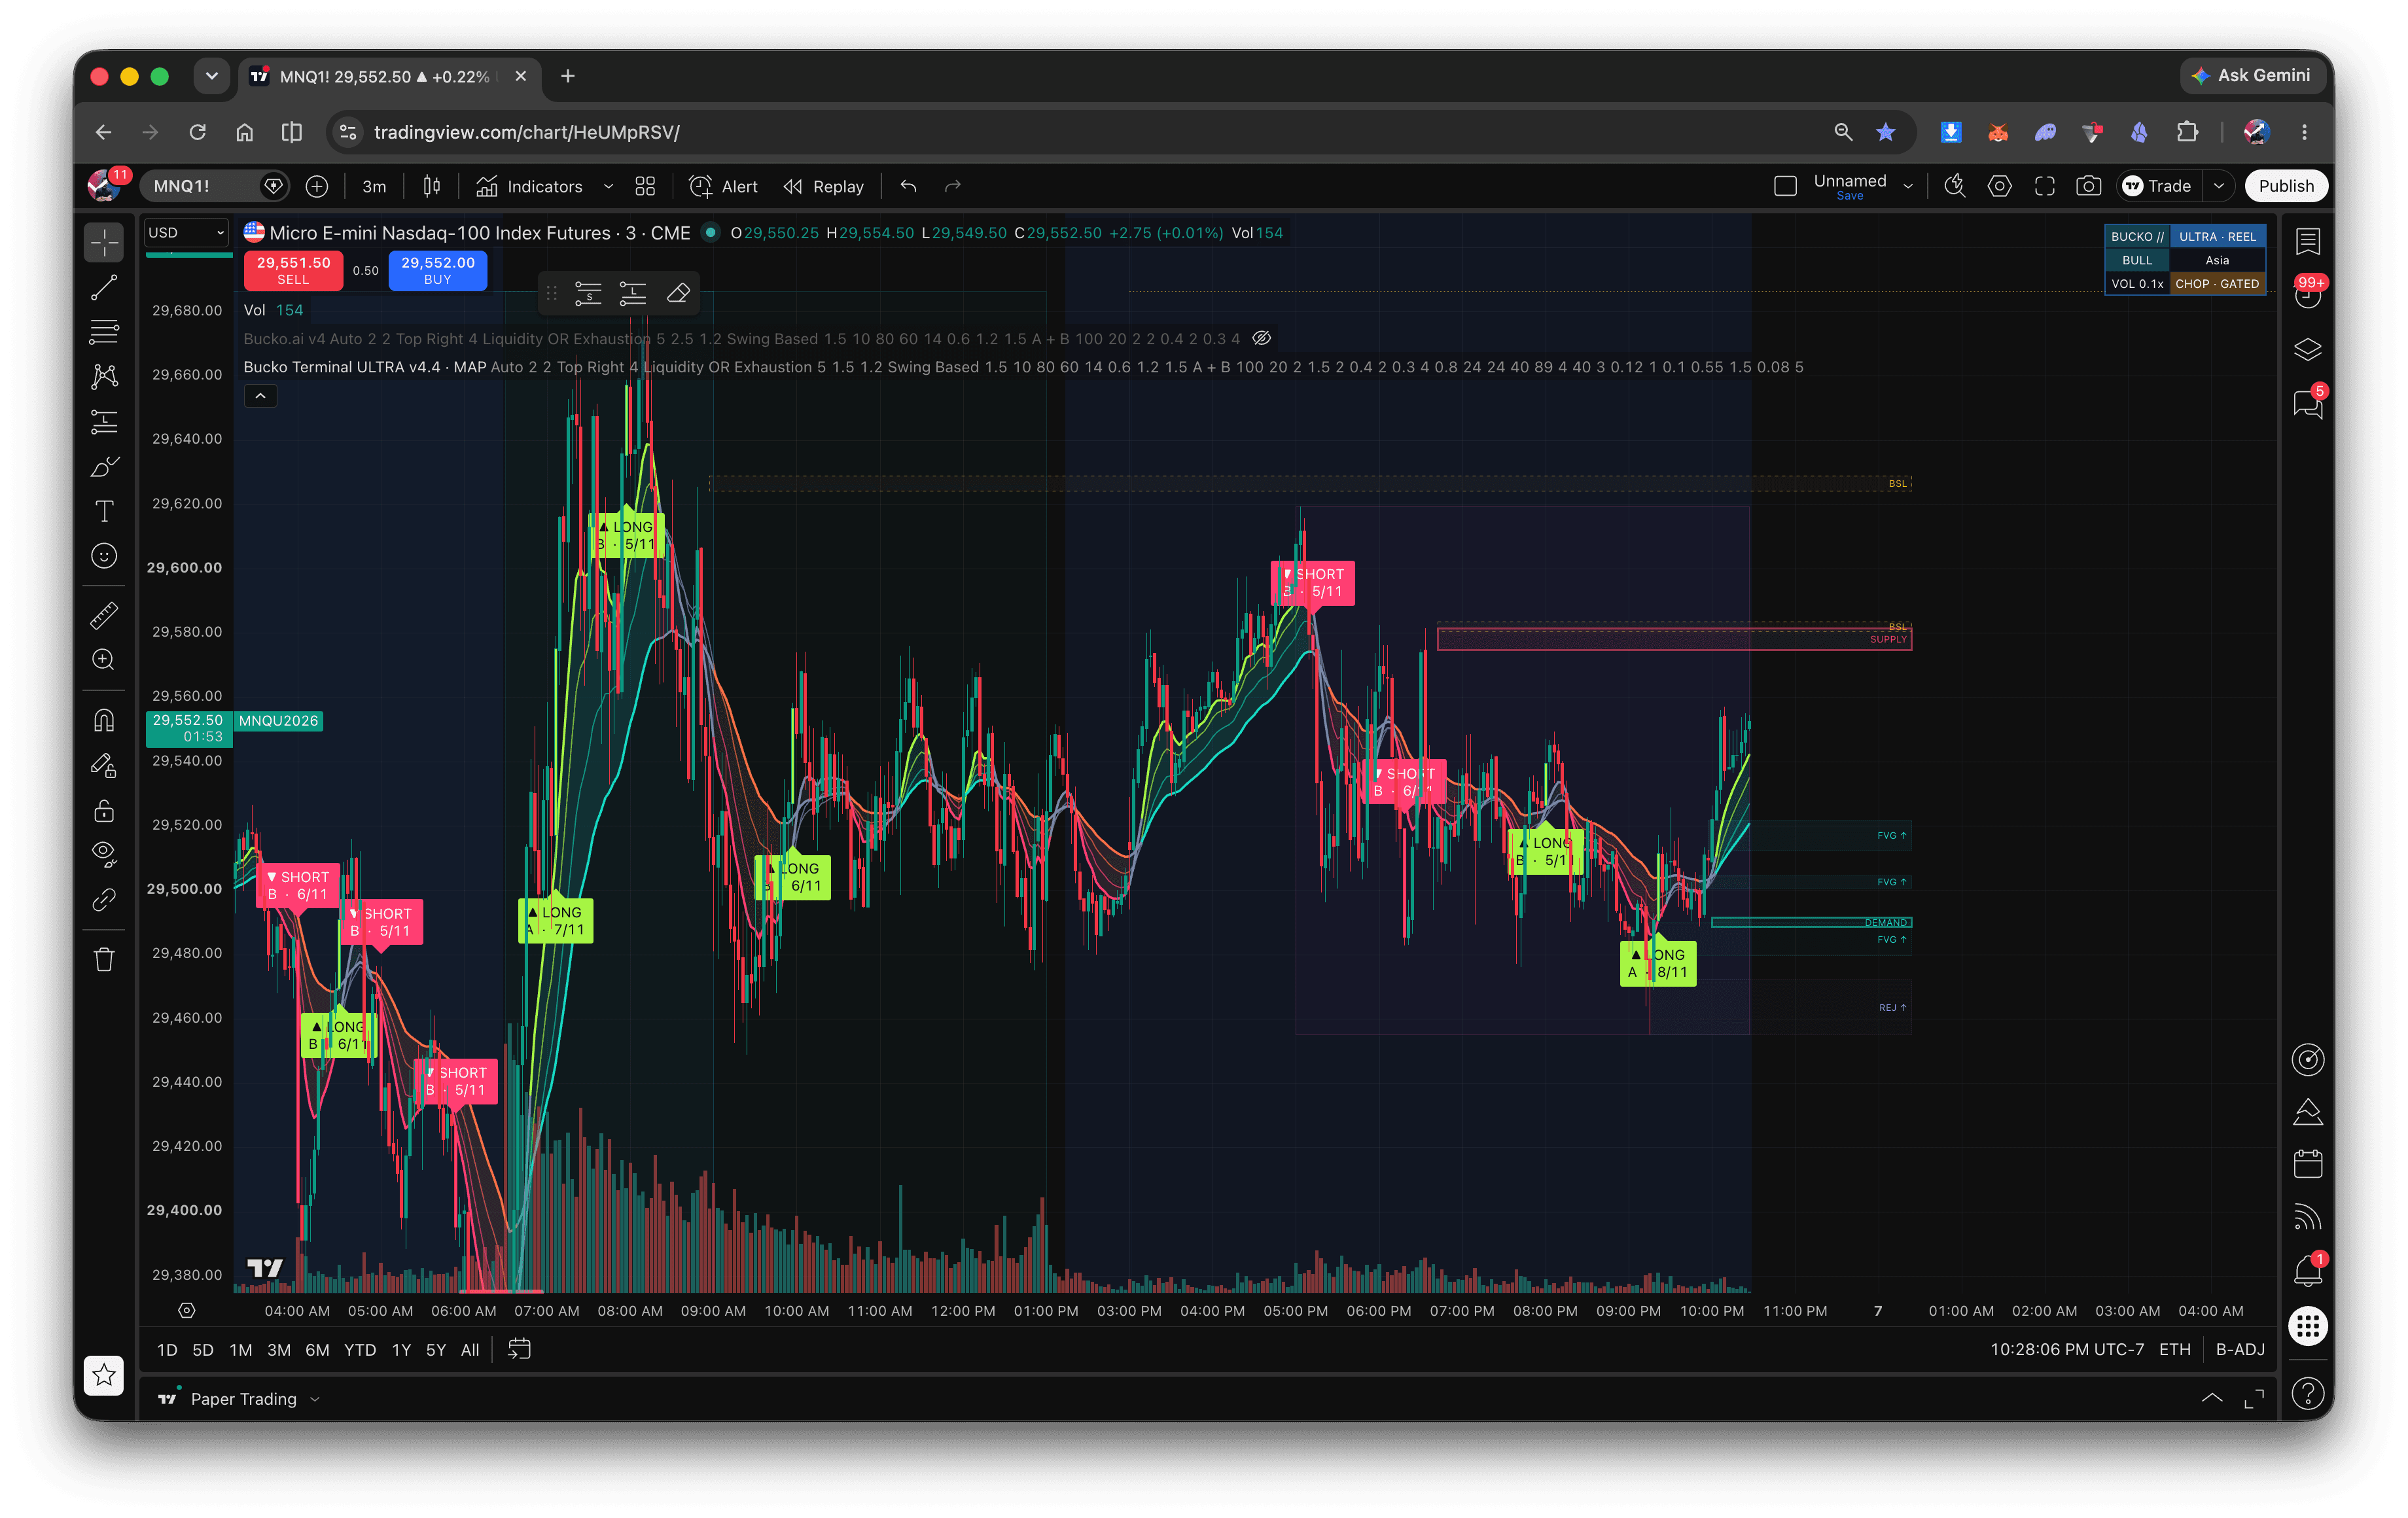
Example chart for education. Zones and labels are rule-based estimates and can be wrong.
Bucko does not ask you to chase every label. Move through the chart in order: direction, location, proof, then risk.
Start with the ribbon and the market status box. Green supports bullish ideas. Red supports bearish ideas. Mixed colors mean slow down.
Look for Demand, Supply, FVG, Liquidity, or Rejection near the current price. Location gives the setup context.
Watch for a reaction, BOS, or a confirmed LONG, SHORT, or REV label. A zone by itself is not an entry.
Check Entry, Stop Loss, and Take Profit. Skip the setup if the risk is too large or the chart is unclear.
The ribbon around price gives you a fast read on direction. Use it as a filter, not as an entry button. Mixed colors can mean the market is choppy or changing direction.
Look for bullish ideas near useful areas.
Look for bearish ideas near useful areas.
Slow down. Waiting is a valid choice.
The status box sums up direction, session, volume, and market mode so you can spot weak conditions faster.
The rectangles are price areas, not exact prices. Each label tells you why that part of the chart may matter.
A demand zone marks an area where price moved up with strength. If price comes back, watch how it reacts. The zone can hold, weaken, or fail.
A supply zone marks an area where price moved down with strength. It shows where sellers may respond if price returns.
FVG means Fair Value Gap. It is an imbalance left by a fast move. Traders watch for price to return, react, or move through it.
Similar highs or lows can attract stops and breakout orders. Bucko marks likely liquidity areas. It does not read live order-book orders.
A rejection area shows a strong response near an important level. It is evidence that the level mattered, not proof of the next move.
A key area brings more than one chart clue together. More agreement can make an area worth watching, but it is never a guarantee.
Each badge explains the kind of setup Bucko sees. Read it with the ribbon and the nearest zone, not by itself.
Bucko’s rules currently lean bullish.
Bucko’s rules currently lean bearish.
A possible reversal is forming after a stretched move.
Break of Structure: price closed beyond a recent swing.
The grade and score show how many Bucko checks agree. They are not a win rate or a promise.
The reference price for the setup.
The price that proves the trade idea wrong.
A planning target for taking profit.
The goal is not to predict every candle. It is to help you slow down, check the evidence, and know where your idea is wrong before you enter.

The Bucko Indicator is included with Super Bucko, along with the research tools and support around it.
Current price. Normally $175/month. Review the current plan before starting checkout.
Review the plan and billing terms before continuing to secure Stripe checkout.
No. Bucko organizes the chart and points out setups worth reviewing. You still choose whether to enter, how much to risk, and when to leave.